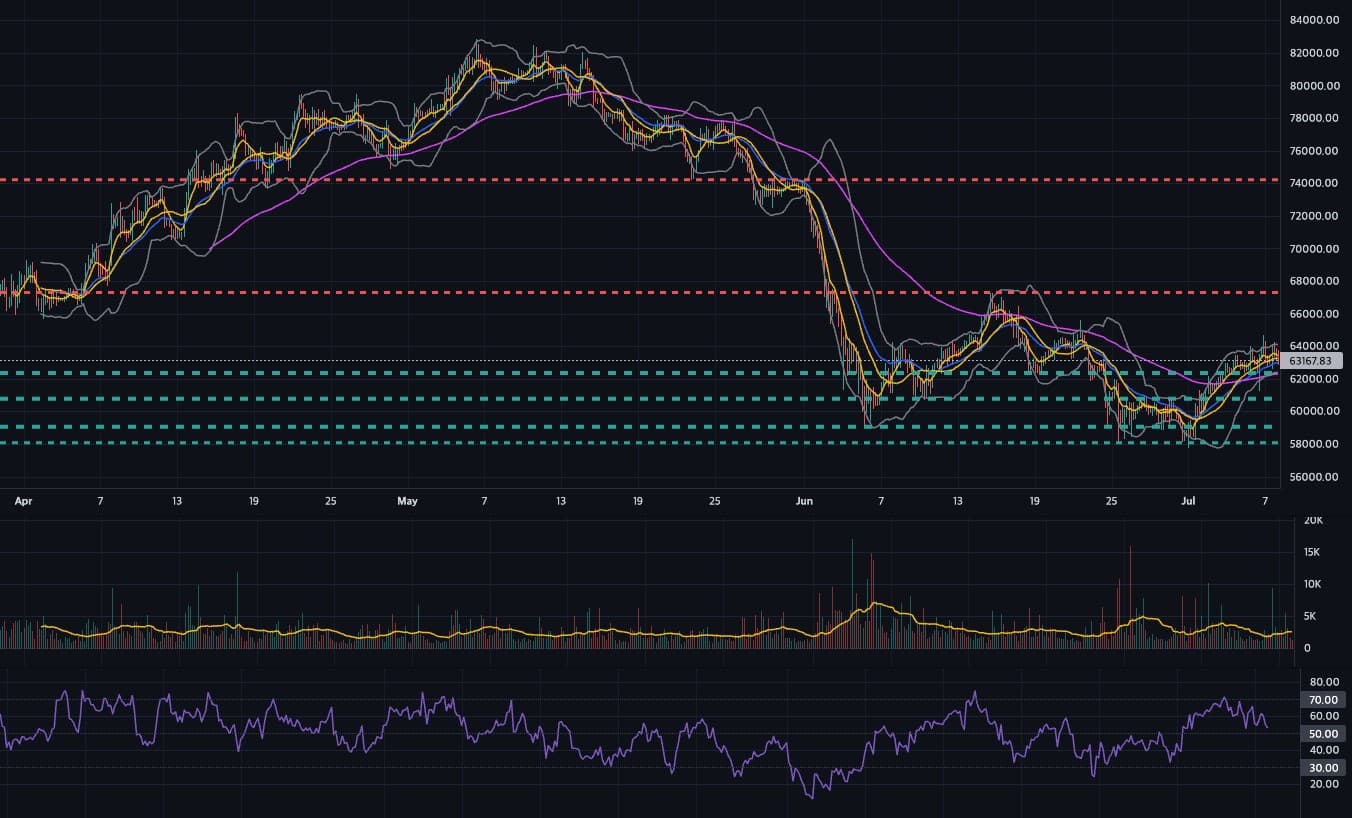
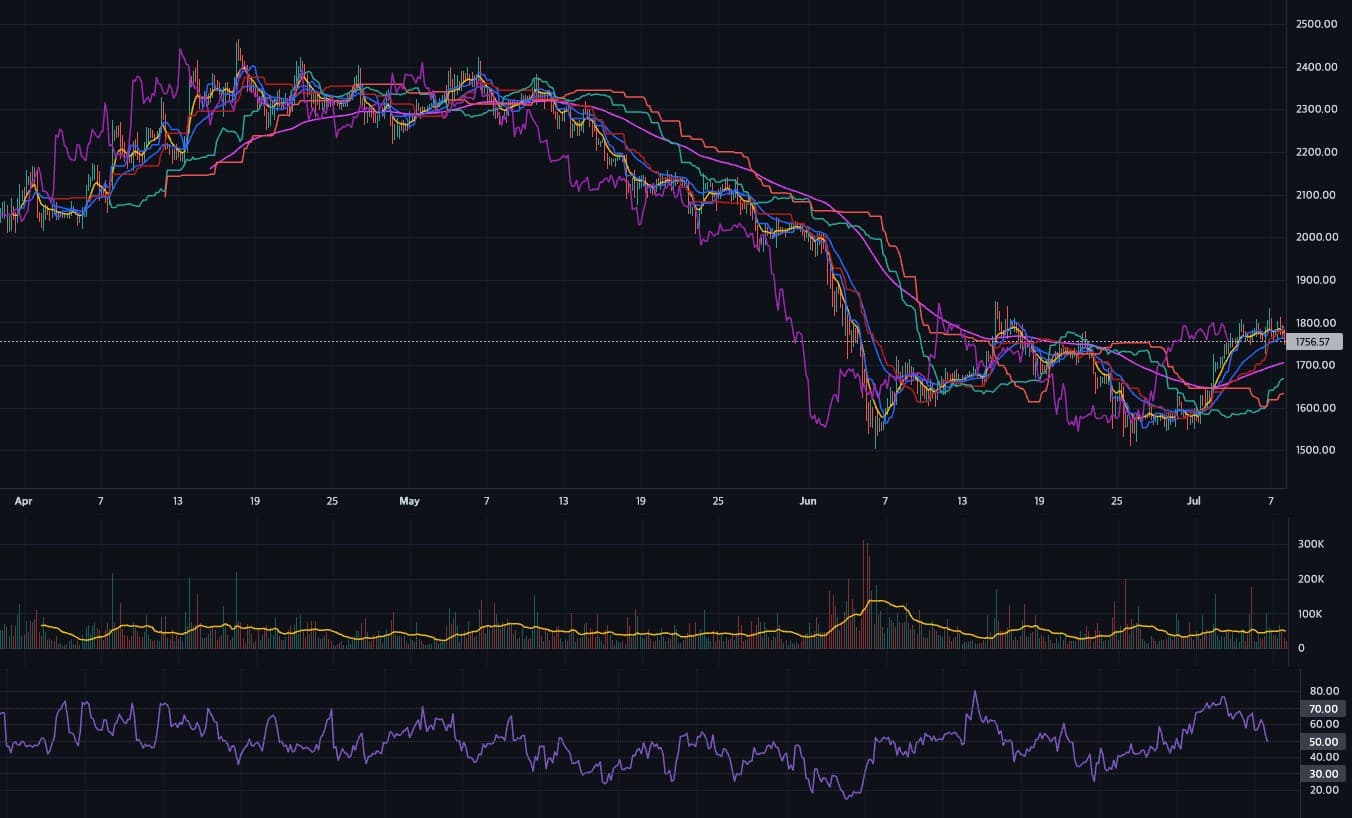
ChartLab
A TradingView-style crypto analysis workspace — 22 technical indicators, drawing tools and real-time candles over live Binance data, with zero framework dependencies.
- Client
- Personal product
- Year
- 2025
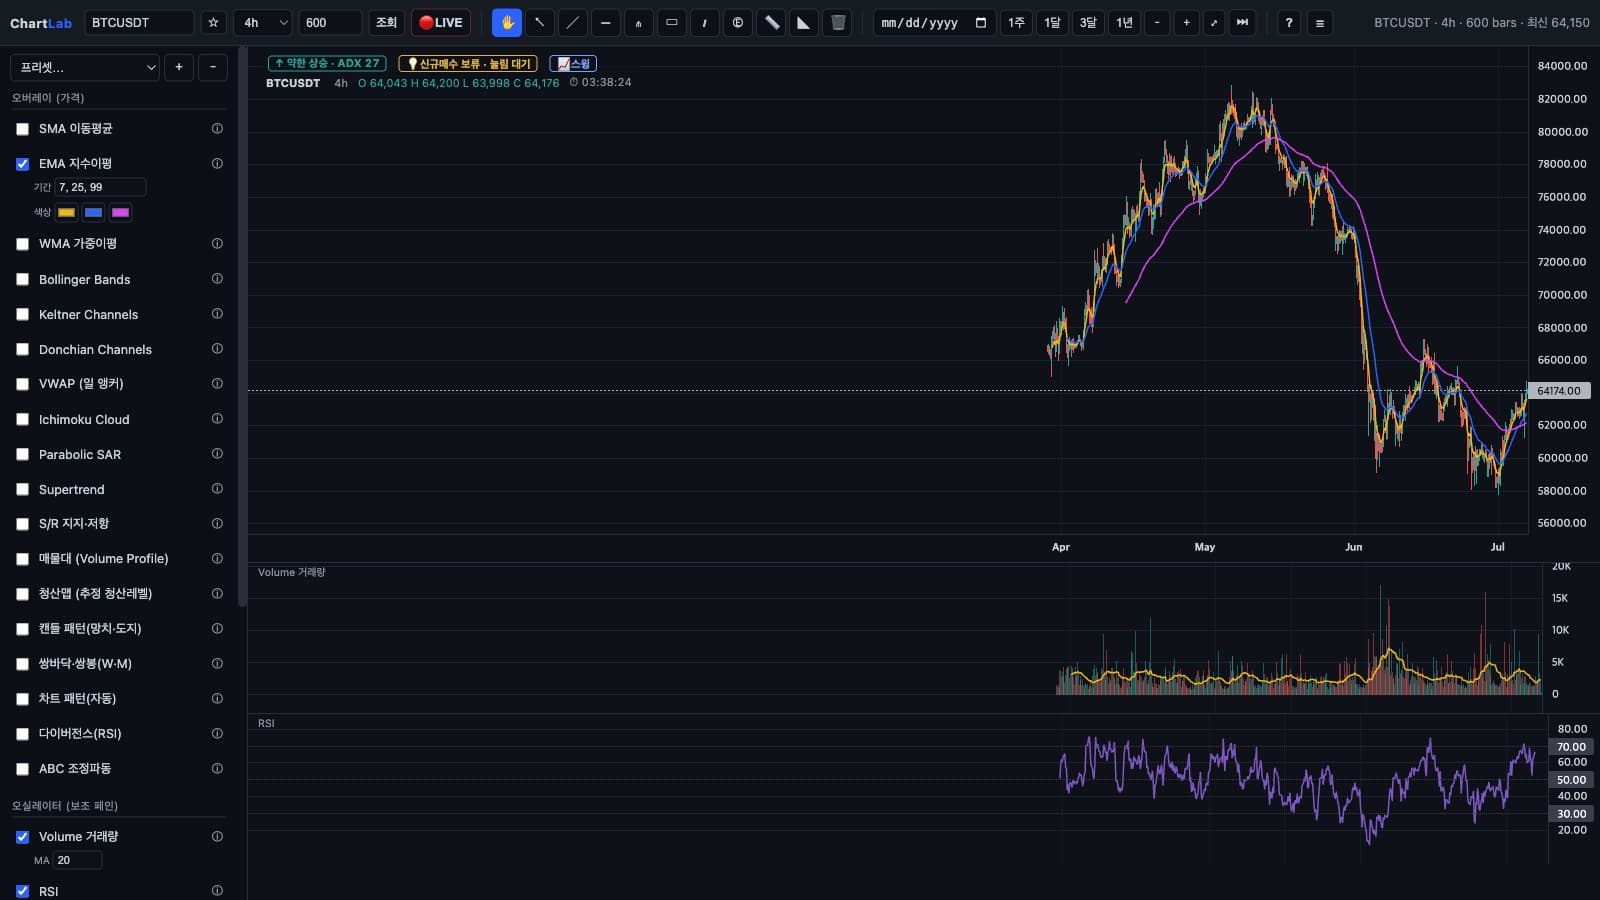
ChartLab is a browser-based technical-analysis workspace for crypto markets. It streams live candles over a Binance WebSocket and layers 22 indicators — SMA, EMA, MACD, RSI, Bollinger Bands, Ichimoku and more — all implemented from scratch rather than pulled from a library.
On top of the chart sits a full drawing toolkit: trendlines, Fibonacci retracements, channels and Elliott-wave tooling, with per-symbol drawings and presets persisted locally so a saved analysis is exactly where you left it.
It runs from a single static file with no build step and no runtime dependencies beyond the charting primitive — a deliberate exercise in doing the hard parts (indicator math, real-time state, canvas interaction) directly, in vanilla JavaScript.